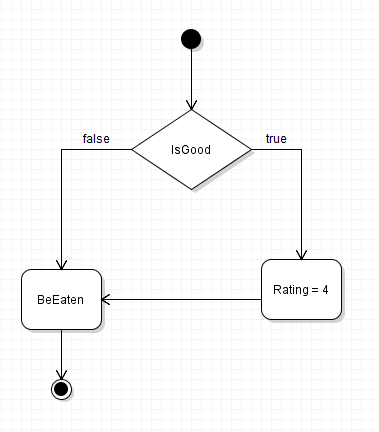
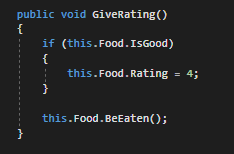
We will be creating a diagram based on the code block below.
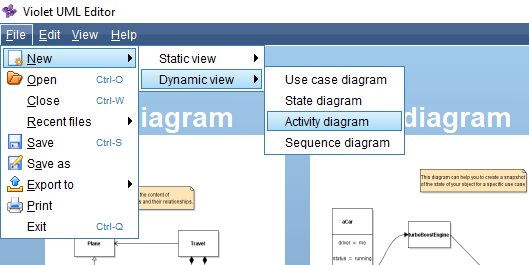
Create a new Activity Diagram in Violet.
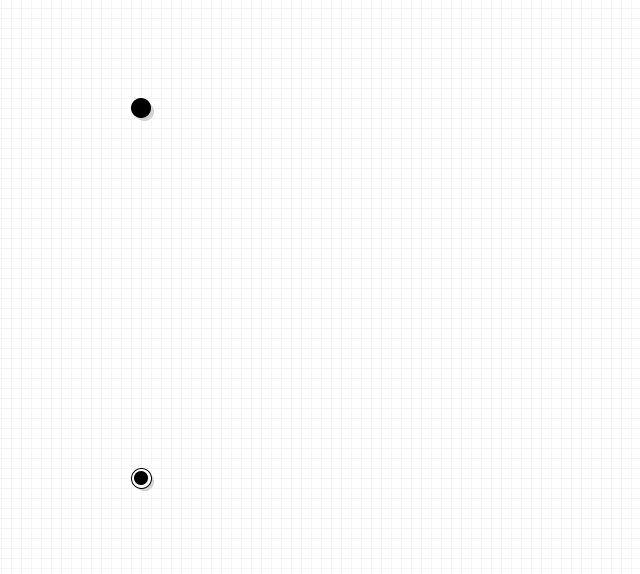
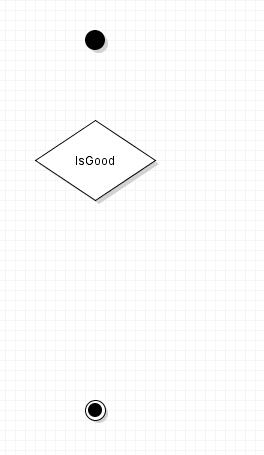
Drop a 'Scenario start' and a 'Scenario end' node into the workspace. These dots represent the opening and closing curly braces of the method.
In the method, the first thing that needs to be represented is the conditional check that uses the IsGood field. To do this, drop an 'Decision' node into the workspace and inside the node, give it the label IsGood.
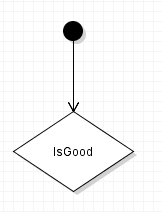
Connect the Scenario start node to the Decision node by selecting the 'Transition' tool and clicking and dragging from the Scenario start to the Activity.
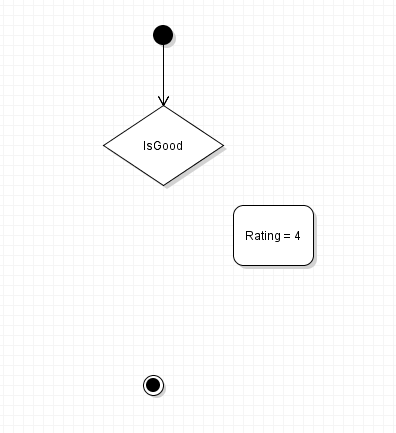
Next, we need to represent the 'Activities' that will take place. In the code block, if the IsGood field is true, the Rating field will be assigned to 4. Additionally, no matter if the conditional evaluates to true or false the Food will BeEaten.
To represent this, drop an 'Activity' node into the workspace and label is with Rating = 4.
Connect the Decision node the to Activity node by selecting the Transition tool and clicking and dragging from the Decision to the Activity.
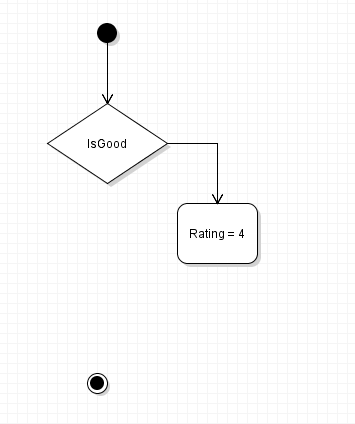
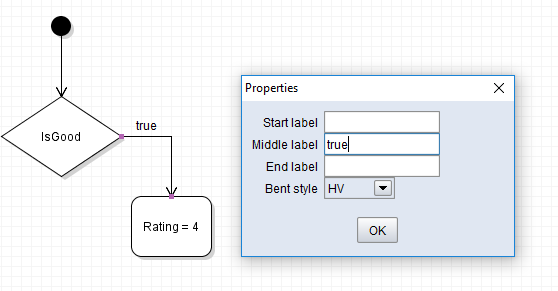
We need to signify that the Rating = 4 Activity only happens when the conditional statements evaluates to true. To do this, double click the line and insert true into the middle label.
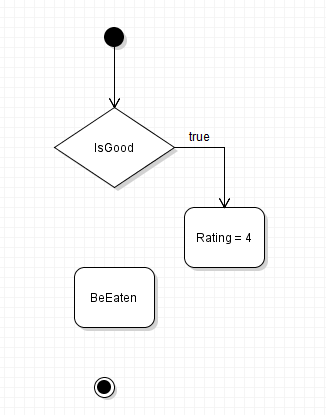
To represent the call to BeEaten, drop a new Activity node into the workspace and label it BeEaten.
Since the BeEaten method will be called regardless of the conditional statement, a line needs to be drawn from both the Decision node and the Rating = 4 Activity node.
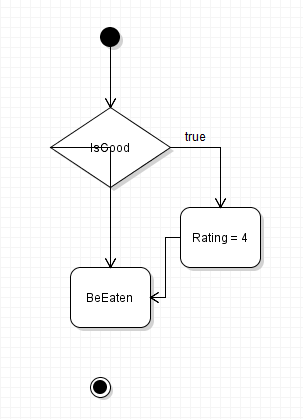
Note that when this happen lines will not look normal. You will need to move nodes around and/or modify the 'Bent style' for it to look cleaner.
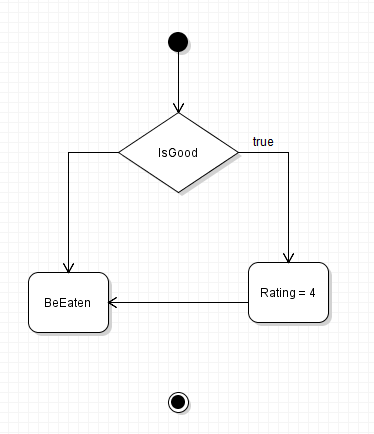
We still need to represent what happens when the conditional statement is false. To do this, double click the line from the Decision node the BeEaten node and insert false into the middle label.
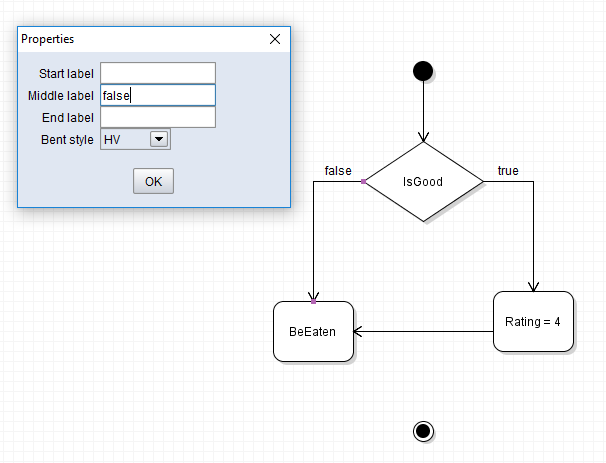
To finalize the diagram, draw a line from the BeEaten node to the Scenario end node.