FIT introduced many individual tools and concepts.
The strongest preparation is not memorizing isolated definitions.
Focus on explaining how the ideas connect.
A useful pattern is:
What problem does this concept help solve, what representation or tool is being used, and what evidence tells you whether the result makes sense?
A structured technical process can move through:
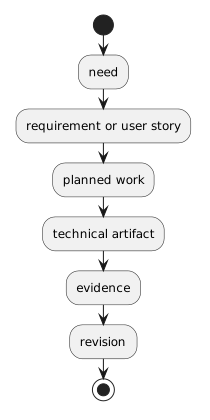
need
↓
requirement or user story
↓
planned work
↓
technical artifact
↓
evidence
↓
revision
Examples of evidence in FIT include:
Be able to explain why evidence matters rather than saying only that a tool "checks the work."
A model is a purposeful simplification.
Abstraction answers:
What information matters for this purpose?
A useful model includes needed information while leaving out irrelevant detail.
The model type should fit the question.
Object diagrams answer:
What specific objects exist in this snapshot?
They can show:
Example idea:
player1 : Player
-------------------------
name = "Jordan"
isAvailable = true
Activity diagrams answer:
What happens next?
They can show:
For web interactions, partitions can separate Browser and Server.
For AI workflows, partitions can separate Human and AI System.
Class diagrams answer:
What software types and attributes represent the system?
Example:
Player
--------------------------------
name : string
jerseyNumber : int
isAvailable : bool
The class describes a kind of object.
An object diagram shows a specific instance of that type.
An ERD is primarily data-oriented.
It describes:
A UML class diagram is primarily software-oriented.
It describes:
The models can contain related concepts without being interchangeable.
A UML object such as:
player1 : Player
-------------------------
name = "Jordan"
can connect to introductory C# such as:
Player player1 = new Player();
player1.name = "Jordan";
UML shows the modeled snapshot.
C# contains executable instructions that create and change runtime state.
The debugger can show the object while the program runs.
Programs execute instructions in an order.
Boolean values represent:
true
false
A simple if condition controls whether a block runs.
An if/else chooses between two paths.
An activity-diagram decision can represent the same reasoning visually.
Answers:
Can the compiler translate the current source?
Helps locate compiler/build diagnostics.
Creates a planned runtime pause.
Executes the current statement and advances through the current flow.
Shows current values and objects.
A program can build successfully and still behave incorrectly.
Build evidence and runtime evidence answer different questions.
Decimal is base 10.
Binary is base 2.
Hexadecimal is base 16.
The same value can have different representations.
Four binary bits correspond directly to one hexadecimal digit.
Hexadecimal web colors provide one visible application:
#RRGGBB
Basic C# types introduced in FIT include:
string
int
double
bool
The type should match the meaning of the information.
UML class attributes can also display types.
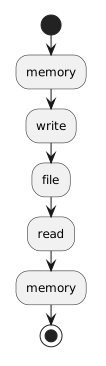
Runtime memory holds information used while the application is running.
Persistent storage allows information to survive beyond the current execution.
A simple text-file flow is:
memory
↓ write
file
↓ read
memory
FIT used:
System.IO.File.WriteAllText(...)
System.IO.File.ReadAllText(...)
to illustrate that movement.
HTML describes webpage structure and meaning.
CSS controls presentation.
A browser interprets both to render a webpage.
Hexadecimal can represent CSS colors.
The Internet provides network connectivity.
The Web uses that connectivity for web resources and request/response interactions.
A browser is a client.
A web server receives requests and sends responses.
A URL can include:
Example:
https://example.com/search?team=wildcats
The query parameter is:
team=wildcats
A C# application can build a URL from supplied user input and ask the browser to open it.
The browser still performs the web request.
Structured data uses consistent fields and records.
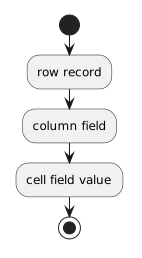
In a spreadsheet:
row → record
column → field
cell → field value
A CSV can represent the same tabular information as plain text.
Clean data uses consistent representations.
A unique ID distinguishes one record from another.
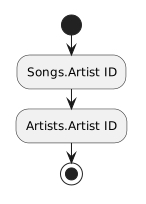
Related tables can connect records using identifiers.
Example:
Songs.Artist ID
↓
Artists.Artist ID
That relationship can be modeled in an ERD.
Sorting changes record order.
Filtering limits the current view.
A PivotTable creates a grouped summary.
A chart visualizes selected data.
A visualization can reveal patterns, but it does not automatically explain why those patterns exist.
The source data still controls the quality of the result.
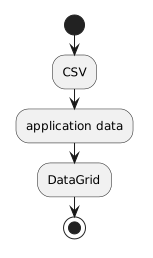
A DataGrid displays structured records in a C# application.
The FIT data path is conceptually:
CSV
↓
application data
↓
DataGrid
The displayed rows and columns should preserve the record-and-field relationships from the source.
Generative AI produces output.
Generated output is not guaranteed fact.
Evaluate:
Important claims may require verification with an authoritative source.
Use data minimization.
Do not share:
Follow the AI-use requirements for the course or workplace.
Be transparent about AI assistance when required.
This framework describes your next action after evaluating technology-supported output.
The decision should be based on:
FIT repeatedly places a person between evidence and action.
Examples:
debugger evidence → decide what code to revise
chart → decide what observation the data supports
web information → decide how to interpret the result
AI output → decide whether to accept, revise, verify, or reject
The common skill is not memorizing tool buttons.
It is using appropriate representations and evidence to make and explain a technical decision.
When explaining a FIT concept, try this structure:
That structure demonstrates understanding across the course rather than recall of isolated vocabulary.