0.6.22 Module 6 Quiz Study Guide

Data Is Represented Information

Data is information represented so it can be stored, communicated, or processed.

Examples include:

A value becomes easier to interpret when its context is clear.

For example:
Plain text
7

is ambiguous.

Plain text
Jersey Number = 7

has a clear meaning.

Structured and Unstructured Data Differ in Organization

Structured data follows a predictable organization.

Example:

Title Artist Genre
Northern Lights Example Band Rock

Unstructured data does not already follow the same repeated field structure.

Examples include:

Neither form is automatically better.

The best representation depends on the task.

Spreadsheets Organize Structured Data

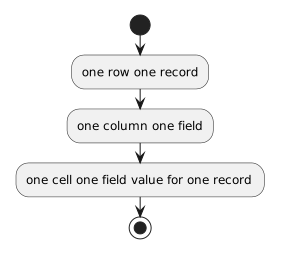
A spreadsheet uses:

A clean data table commonly uses:

Plain text
one row → one record
one column → one field
one cell → one field value for one record

Headers make the field meanings visible.
Records and Fields Describe the Logical Structure

A record represents one item.

A field represents one defined piece of information about that item.

For a song table:

Plain text
one record = one song

Possible fields:

Plain text
Song ID
Title
Artist
Genre
Year

Rows and columns are spreadsheet structures.

Records and fields describe the data meaning behind them.

CSV Represents Tabular Data as Text

A CSV file can represent:

Plain text
Title,Artist,Genre
Northern Lights,Example Band,Rock

A spreadsheet can display the same data in cells.

CSV is useful for exchanging structured data between systems.

It does not preserve all spreadsheet features such as charts or multiple worksheet tabs.

Clean Data Uses Consistent Representations

Inconsistent category values such as:

Plain text
Rock
rock
ROCK

can create separate groups during analysis.

Other common consistency problems include:

A chart or PivotTable reflects the source data it receives.

It cannot automatically repair poor data quality.

Unique IDs Distinguish Records

Two records can have the same visible name.

A unique identifier gives each record a stable identity.

Example:

Plain text
S001
S002
S003

An ID should be unique within its intended record set and should normally remain stable even when descriptive information changes.

IDs Can Connect Related Records

Suppose:

Plain text
Artist ID = A002

identifies Example Band.

A Song record can contain:

Plain text
Artist ID = A002

to refer to that artist record.

This lets related tables connect without repeating all artist information in every song row.

Entities, Attributes, and Relationships Describe Data Structure

An entity represents a kind of record.

Examples:

Plain text
Song
Artist
Album

An attribute represents information about that entity.

A relationship connects entities.

An ERD visualizes those concepts.

ERDs Are Data-Oriented Models

An entity-relationship diagram can show:

It answers questions such as:

What record types exist?

Which fields belong to them?

How are their records connected?

Sorting Changes Order

Sorting changes the displayed order of records.

For example:

Plain text
Year ascending

can place earlier years before later years.

A proper table sort keeps each record's values together.

Filtering Limits the Current View

Filtering can temporarily show only records that meet a condition.

For example:

Plain text
Genre = Rock

Hidden records still exist in the source dataset.

Filtering is not the same as deleting them.

Summaries Reduce Many Records Into Results

A summary can answer questions such as:

How many songs are in each genre?

or:

What is the average rating for each genre?

The calculation should match the meaning of the field and the question.

PivotTables Create Grouped Summaries

A PivotTable can organize a question into fields.

For:

How many songs are in each genre?

a useful structure is:

Plain text
Rows: Genre
Values: Count of Song ID

The PivotTable is a derived summary.

It does not replace the detailed source records.

Charts Visualize Selected Data

A chart can make comparisons or patterns easier to notice.

A chart should have:

The visualization should support accurate interpretation rather than decorative complexity.

Visualizations Show a Selected View

A chart represents the:

It does not automatically explain why a pattern exists.

A useful observation states what the current visualization actually supports.

UML Class Diagrams Model Software Structure

A UML class diagram can describe:

Example:

Plain text
Player
--------------------------------
playerId : string
name : string
jerseyNumber : int

One class can describe the structure shared by many Player objects.

ERDs and UML Class Diagrams Have Different Emphases

ERD

How are structured records, identifiers, and data relationships organized?

UML class diagram

What software types, attributes, and class relationships represent the system?

The diagrams may contain related concepts without being interchangeable.

A DataGrid Displays Structured Data Inside an Application

A DataGrid presents records as visible rows and fields as visible columns.

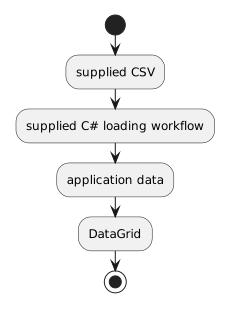
For the First Day activity, the core information path is:

Plain text
supplied CSV
      ↓
supplied C# loading workflow
      ↓
application data
      ↓
DataGrid

The goal is to recognize that representative CSV records and fields remain associated correctly when displayed by the application.

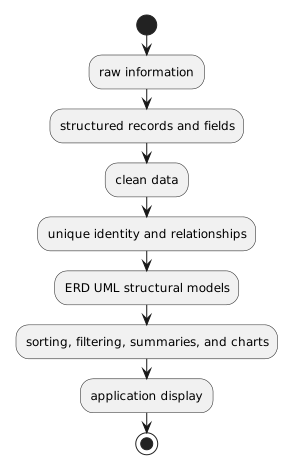
Module 6 Connects Organization, Modeling, and Presentation

The overall progression is:

Plain text
raw information
      ↓
structured records and fields
      ↓
clean data
      ↓
unique identity and relationships
      ↓
ERD / UML structural models
      ↓
sorting, filtering, summaries, and charts
      ↓
application display

The important question throughout the module is:

How is the information structured, related, transformed, and represented at this stage?