You have already seen structured data in:
A C# desktop application can also display tabular information.
A DataGrid is a user-interface control designed to show data in rows and columns.
Conceptually:
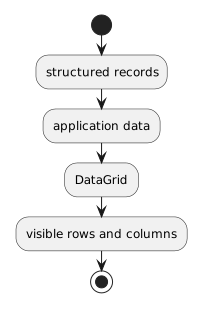
structured records
↓
application data
↓
DataGrid
↓
visible rows and columns
This gives you another representation of the same structured information.
Imagine a simple soccer CSV:
PlayerId,Name,JerseyNumber
P001,Jordan,7
P002,Casey,1
The file contains:
A DataGrid might display:
| PlayerId | Name | JerseyNumber |
|---|---|---|
| P001 | Jordan | 7 |
| P002 | Casey | 1 |
The visual result should preserve the relationship between each record and its field values.
A DataGrid is a display control.
It does not automatically search the computer for useful CSV files.
The application first needs structured information to display.
For the First Day Module 0.6 assessment, the supplied project already provides the guided data-loading workflow.
Your job is not to design a CSV parser or a new application architecture.
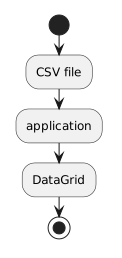
Focus on tracing the supplied data from:
CSV file
↓
application
↓
DataGrid
Suppose one CSV row is:
P001,Jordan,7
In a DataGrid, that record might appear as:
P001 | Jordan | 7
The punctuation disappears because the DataGrid uses columns instead of commas.
The information should still remain associated correctly.
P001 is still the ID.
Jordan is still the name.
7 is still the jersey number.
The CSV header:
PlayerId,Name,JerseyNumber
defines the field positions.
A DataGrid represents those fields as columns.
Conceptually:
CSV field → application field/property → DataGrid column
The exact mapping depends on the supplied project.
You do not need to invent different column names or redesign the model to understand the relationship.
A simplified instructional class might look like:
class Player
{
public string playerId;
public string name;
public int jerseyNumber;
}
One object can represent one structured player record.
For example:
playerId = "P001"
name = "Jordan"
jerseyNumber = 7
A group of similar objects can then be displayed as rows.
The exact supplied First Day course-data model may use different names and structures.
Use its existing design during the assessment.
This distinction is important.
The DataGrid shows information.
The source information exists elsewhere.
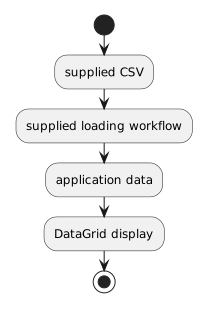
For the FIT assessment:
supplied CSV
↓
supplied loading workflow
↓
application data
↓
DataGrid display
Changing how a column looks does not automatically change the original CSV file.
Likewise, seeing a row on the screen does not mean the source file was rewritten.
If one CSV row describes one course record, the DataGrid row should still represent that same record.
Values should not shift between records.
For example:
Course Code = ABC101
Course Name = Intro Course
must not accidentally become:
Course Code = Intro Course
Course Name = ABC101
A visible table can look orderly while still associating the wrong values with the wrong fields.
Compare representative records, not only the number of displayed rows.
In the First Day Module 0.6 activity, the important learner work is to:
The learning goal is the data relationship, not independent parser design.
Module 0.6 now gives you several ways to view structured information.
plain-text row and field representation
editable grid of rows and columns
data-oriented structural model
software-oriented structural model
application presentation of structured records
Understanding which representation you are looking at—and what role it serves—is more important than treating every table-shaped artifact as the same thing.