When the debugger pauses inside a method, that method may have been called by another method, which may have been called by another method.
The Call Stack shows that active chain.
It helps answer:
How did execution get here?
Suppose:
player1.ShowTeamName();
calls:
this.team.DisplayName();
While execution is paused inside DisplayName(), the active method chain is conceptually:
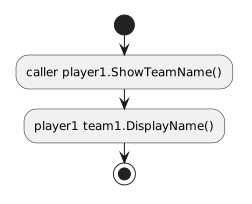
DisplayName()
ShowTeamName()
original caller
The current method is at the top of the active chain.
The earlier callers are below it.
If the debugger pauses inside:
DisplayName()
the Call Stack can help you see:
This lets you reconstruct the path execution followed.
A highlighted source line tells you:
Where am I now?
The Call Stack adds:
How did I arrive here?
That difference becomes important when the same method can be called from more than one location.
The stack primarily identifies method-call locations.
Combine it with current object information.
For example:
current method: DisplayName()
current object: team1
caller method: ShowTeamName()
caller object: player1
Now you can explain both:
Visual Studio lets you inspect stack frames.
When you select an earlier frame, you can examine the source context for that caller.
The exact interface can vary.
Remember that inspecting an earlier frame does not mean program execution has automatically moved backward.
You are viewing the context of an active caller.
While inside DisplayName():
DisplayName()
ShowTeamName()
caller
After DisplayName() finishes:
ShowTeamName()
caller
After ShowTeamName() finishes:
caller
Method completion removes that call from the active stack.
A sequence diagram shows the designed order of messages.
The Call Stack shows the runtime nesting that currently exists.
For a nested interaction:
caller → player1.ShowTeamName()
player1 → team1.DisplayName()
the stack observed inside the Team method provides evidence that the nested call occurred.
The Call Stack shows active calls.
A method that already finished is no longer an active stack frame.
It is not a permanent log of every method the program has ever executed.
When you pause inside an unfamiliar method, ask:
Which method called this one?
Then use the Call Stack to move outward through the active call chain.
That makes nested execution much easier to explain than guessing from the current source file alone.