You already know that F10 / Step Over can execute a method call without taking you line-by-line through the called method.
When you need to see what happens inside the called method, use Step Into.
A common Visual Studio shortcut is:
F11
Suppose execution is paused at:
player1.ShowTeamName();
The debugger executes ShowTeamName() and moves to the next statement in the caller.
You do not trace its internal statements one by one.
The debugger enters ShowTeamName() so you can inspect its internal execution.
Use the command that matches the question you are asking.
Suppose:
public void ShowTeamName()
{
this.team.DisplayName();
}
After stepping into ShowTeamName(), inspect:
this
It should represent the Player object that received the call.
Now you have runtime evidence about the current object.
Execution reaches:
this.team.DisplayName();
If you press F11 again, the debugger can enter the Team's DisplayName() method.
Now inspect:
this
again.
It refers to the Team object receiving that nested call.
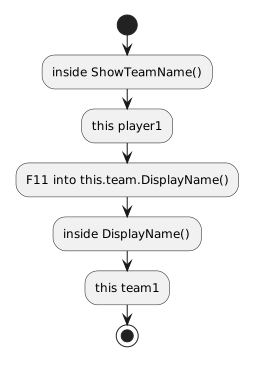
Conceptually:
inside ShowTeamName()
this → player1
F11 into this.team.DisplayName()
inside DisplayName()
this → team1
This makes object-to-object method calls visible.
While inside the nested Team method, the Call Stack can show:
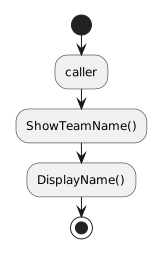
DisplayName()
ShowTeamName()
caller
The current source and the Call Stack work together:
Do not press F11 repeatedly without a question.
Useful questions include:
this?Stepping is most useful when you predict what should happen first.
Some statements call .NET or framework methods.
For the current PC1 work, focus on methods that belong to the learner-facing classes and interactions being studied.
You do not need to trace deeply into framework implementation to understand your own method calls.
After the called method completes, execution returns to its caller.
For:
caller
↓
ShowTeamName()
↓
DisplayName()
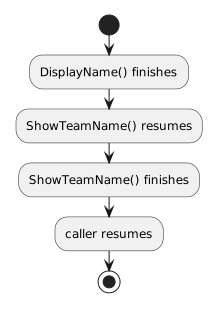
the return path is:
DisplayName() finishes
↓
ShowTeamName() resumes
↓
ShowTeamName() finishes
↓
caller resumes
Even void methods return execution to their caller.
They simply do not return a data value.
Use:
F5 / Continue
Run to the next planned pause.
F10 / Step Over
Execute the current statement without tracing into called methods.
F11 / Step Into
Enter a called method and trace its internal execution.
These commands give you different levels of detail.
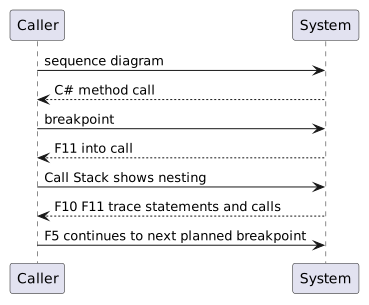
You can now connect:
sequence diagram
↓
C# method call
↓
breakpoint
↓
F11 into call
↓
Call Stack shows nesting
↓
F10/F11 trace statements and calls
↓
F5 continues to next planned breakpoint
That gives you a complete introductory workflow for understanding method execution before parameters and return values are introduced.