1.1.15 The Autos Window

The Autos Window Shows Values Related to the Current Execution Point

When a C# program is paused in the debugger, Visual Studio can display runtime information in several debugger windows.

The Autos window focuses on variables, references, and expressions related to the current and nearby statements.

It is useful when you want to answer:

What values are relevant right here?

Begin With a Breakpoint

Suppose the source contains:

C#
Player player1 = new Player();
player1.name = "Jordan";
player1.jerseyNumber = 7;

Set a breakpoint at a useful location and start debugging.

When execution pauses, open the Autos window using the course's Visual Studio workflow.

The exact layout can vary by Visual Studio version.

Focus on the information rather than memorizing one screen arrangement.

Values Depend on Where Execution Is Paused

If execution pauses before:

C#
Player player1 = new Player();

then the object has not yet been created by that statement.

If execution pauses immediately after the statement, player1 can refer to the new Player object.

If execution pauses after the field assignments, the object can show the updated state.

Debugger evidence always belongs to a specific moment in execution.

Expand an Object to Inspect Its Members

If the Autos window shows:
Plain text
player1

you can expand that object/reference when Visual Studio makes it available.

You may see fields such as:

Plain text
name
jerseyNumber
isAvailable

For example:

Plain text
player1
  name = "Jordan"
  jerseyNumber = 7
  isAvailable = true

This is runtime evidence about the object.

It is not merely a copy of the source code.

Compare Autos With the UML Snapshot

Suppose UML requires:

Plain text
player1 : Player
-------------------------
name = "Jordan"
jerseyNumber = 7

After the relevant assignments execute, inspect player1.

If Autos shows:

Plain text
name = "Jordan"
jerseyNumber = 7

the runtime state supports the UML mapping.

If Autos shows:

Plain text
jerseyNumber = 0

ask whether the assignment has executed yet.

The current source location matters.

Default Values Are Easy to Observe Here

Immediately after object creation, Autos can help you see fields before scenario values are assigned.

Conceptually:

Plain text
player1
  name = null
  jerseyNumber = 0
  isAvailable = false

After F10 steps through assignments, those values can change.

This makes default field values concrete.

Autos Is Not a Permanent Record

The Autos window reflects the current debug session and execution location.

When the program continues:

Do not treat one screenshot of Autos as proof of every future program state.

It is evidence from one runtime moment.

Use F10 to Connect Source to State

A useful process is:

  1. Pause before a field assignment.
  2. Inspect the current value in Autos.
  3. Predict the new value.
  4. Press F10.
  5. Inspect the value again.

For:

C#
player1.jerseyNumber = 7;

you might observe:

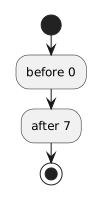
Plain text
before → 0
after  → 7

That connects:

Plain text
source statement → execution → state change

Autos Can Help With Object References Too

If a field or variable can refer to another object, Autos may show:

Plain text
null

before a reference is assigned.

Later, it may show an expandable object.

That difference becomes especially useful in CO-029 when diagnosing nested references and NullReferenceException.

Do Not Change Code Based Only on a Surprising Value

If a value looks wrong, first ask:

The debugger provides evidence.

You still need to interpret it in relation to the code and model.

The Main Use

The Autos window helps answer:

What relevant objects and values exist at this point in execution?

Use it to connect the written source with the runtime state you can actually observe.