Put a Category in the Row Area
For the question:
the grouping field is:
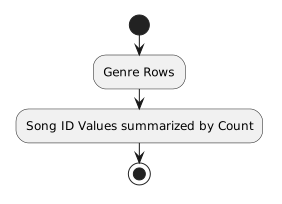
- New
- Changed
- Removed
The result can become:
| Genre | Count of Song ID |
|---|---|
| Jazz | 12 |
| Pop | 19 |
| Rock | 28 |
A PivotTable takes a structured dataset and creates a grouped summary.
Suppose a music dataset contains one row per song.
You want to answer:
Reading and counting every row manually would be inefficient.
A PivotTable can group the records by Genre and calculate a count.
Before creating the PivotTable, confirm that the source data has:
A PivotTable depends on that structure.
Poorly organized source data produces poor summaries.
The PivotTable needs access to the records and the fields you want to summarize.
Use the complete intended table, including its header row.
Do not select only the visible values from one column if the summary needs fields from several columns.
The PivotTable works by understanding the field names in the dataset.
For the question:
the grouping field is:
The result can become:
| Genre | Count of Song ID |
|---|---|
| Jazz | 12 |
| Pop | 19 |
| Rock | 28 |
Spreadsheet software can offer summaries such as:
The correct choice depends on the field.
For Song ID, a count is meaningful.
A sum of Song IDs would not be meaningful because the identifiers are not quantities.
Choose the calculation from the question and the data meaning.
Question:
Possible structure:
Rows: Genre
Values: Count of Song ID
Question:
If a numeric Rating field exists:
Rows: Genre
Values: Average of Rating
The PivotTable design changes because the question changes.
If the source contains:
Rock
rock
ROCK
the PivotTable may create separate groups.
That is not a PivotTable failure.
It reflects inconsistent source values.
Return to the underlying dataset and clean the category representations before trusting the summary.
The detailed rows still matter.
The PivotTable is a derived view.
Use the source table when you need individual records.
Use the PivotTable when you need grouped results.
This separation allows you to move between detail and summary.
If the source dataset changes, a PivotTable may need to be refreshed or recalculated depending on the spreadsheet environment.
Do not assume a summary always reflects edits that occurred later.
Make sure the displayed summary corresponds to the current source data before interpreting it.
Do not stop at seeing numbers.
Turn the PivotTable into plain language.
For example:
That sentence connects the spreadsheet output to an interpretable result.
The next step is deciding whether a chart can make that comparison easier to see.