The Same Domain Can Be Modeled for Different Purposes
A music library, soccer system, or course catalog can be represented in several ways.
Two useful structural models are:
- an entity-relationship diagram , or ERD;
- a UML class diagram .
Both can show kinds of things, information about them, and relationships.
They are not the same diagram.
The easiest way to distinguish them is to ask:
An ERD Focuses on Structured Data
An ERD is primarily concerned with organized data.
For a soccer dataset, it might represent:
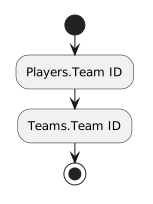 PlayersTeamID.
The ERD represents that data relationship.
A UML class diagram may show:
to express that Player and Team objects are structurally related in the software model.
The exact implementation of that software relationship is not the main concern of this FIT activity.
A Spreadsheet Is a Third View
You can also compare both diagrams to the actual data table.
Spreadsheet
P001 | Jordan | 7 | T001
P002 | Casey  | 1 | T001
This shows current records and values.
ERD
Player entity
Team entity
identifiers
attributes
relationship
This shows data structure.
UML class diagram
Player class
Team class
typed attributes
software relationship
This shows software structure.
Three representations can describe the same general domain from different viewpoints.
Avoid Mechanical Conversion
Do not assume:
Do not assume:
Do not assume:
Those conversions may sometimes be appropriate, but the model's purpose must guide the decision.
Use the Representation That Fits the Work
Choose an ERD when the main concern is:
- structured records;
- identifiers;
- data relationships.
Choose a UML class diagram when the main concern is:
- software types;
- typed attributes;
- class relationships.
Use the spreadsheet when the main concern is:
- current rows;
- current values;
- sorting, filtering, or analysis.
The strongest model is the one whose representation matches the question being answered.