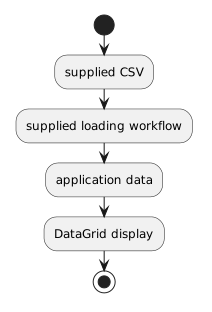
You have already seen structured data in:
A C# desktop application can also display tabular information.
A DataGrid is a user-interface control designed to show data in rows and columns.
Conceptually:
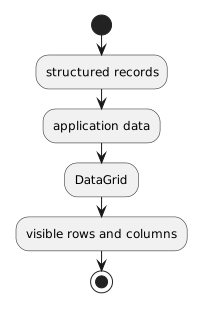
This gives you another representation of the same structured information.
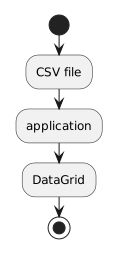
Imagine a simple soccer CSV:
Suppose one CSV row is:
Changing how a column looks does not automatically change the original CSV file.
Likewise, seeing a row on the screen does not mean the source file was rewritten.
If one CSV row describes one course record, the DataGrid row should still represent that same record.
Values should not shift between records.
For example:
Course Code = ABC101
Course Name = Intro Coursemust not accidentally become:
Course Code = Intro Course
Course Name = ABC101A visible table can look orderly while still associating the wrong values with the wrong fields.
Compare representative records, not only the number of displayed rows.
In the First Day Module 0.6 activity, the important learner work is to:
The learning goal is the data relationship, not independent parser design.
Module 0.6 now gives you several ways to view structured information.
plain-text row and field representationeditable grid of rows and columnsdata-oriented structural modelsoftware-oriented structural modelapplication presentation of structured recordsUnderstanding which representation you are looking at—and what role it serves—is more important than treating every table-shaped artifact as the same thing.