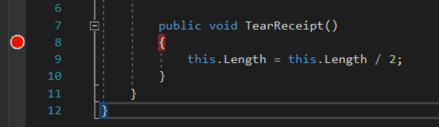
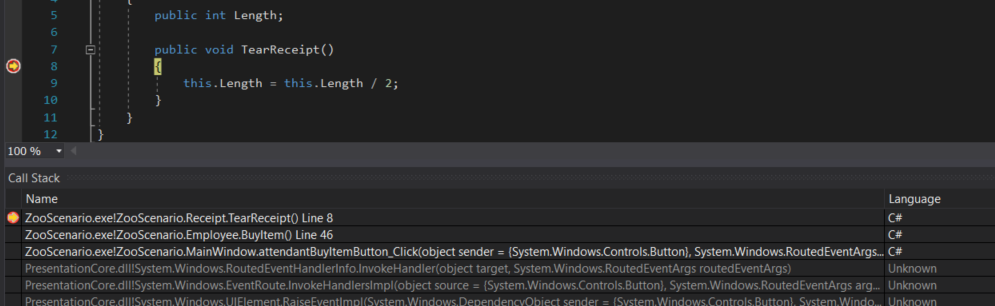
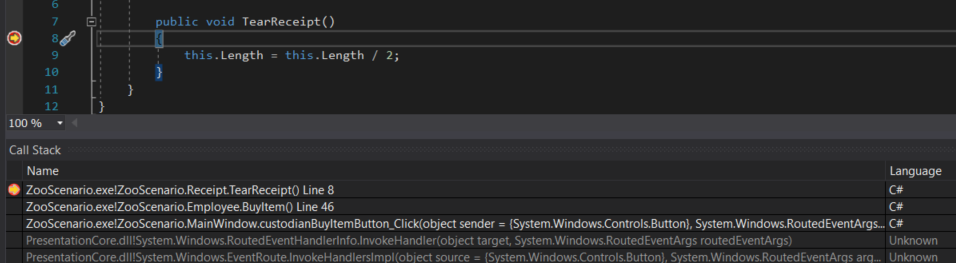
Let's say we have this method TearReceipt and we don't know anything about it so we put a breakpoint on the opening curly brace of the method.
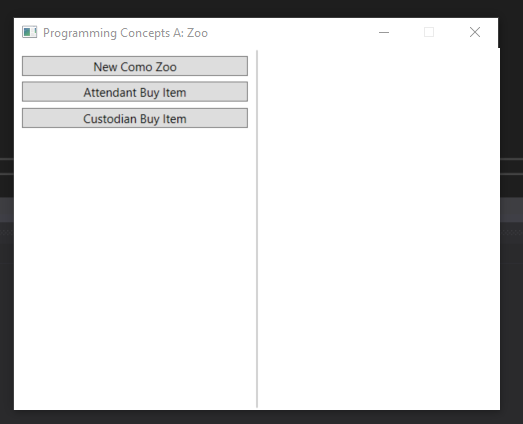
Let's run the application to see if any of our buttons hit the breakpoint. We'll push the New Como Zoo button and Attendant Buy Item button.
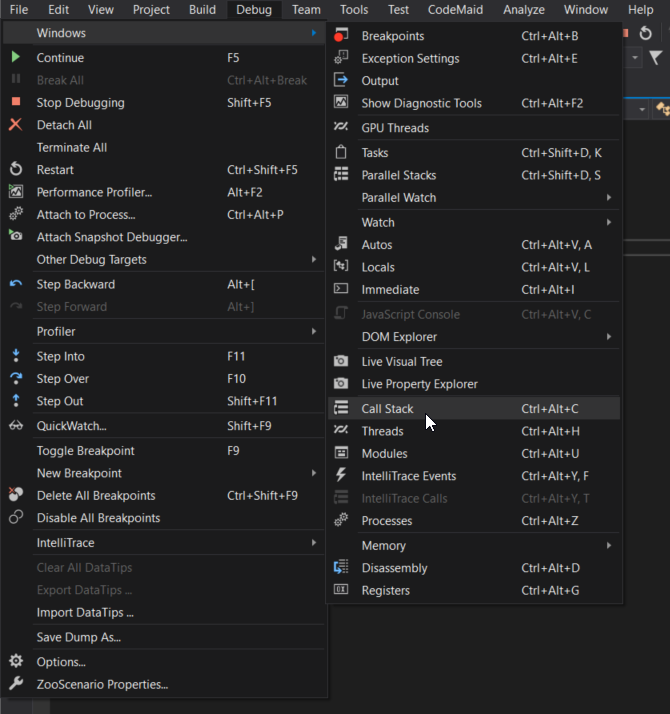
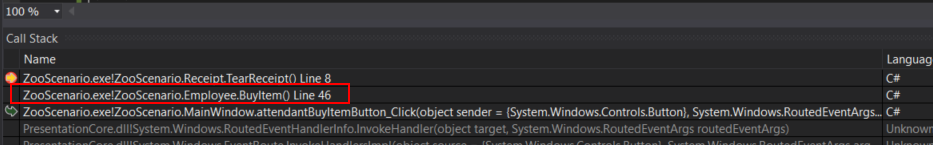
Our breakpoint is hit, which is good information. But how did it get there? We can use the Call Stack for that. If the Call Stack isn't already showing as a tab next to your Autos or Locals window, go to Debug | Windows | Call Stack to show the Call Stack window.
The Call Stack will show some white text and some gray text. Don't worry about the gray text it's all "uder the hood" stuff that we aren't concerned about. The white text, however, shows the calls that were made that got us to this particular point in the application.
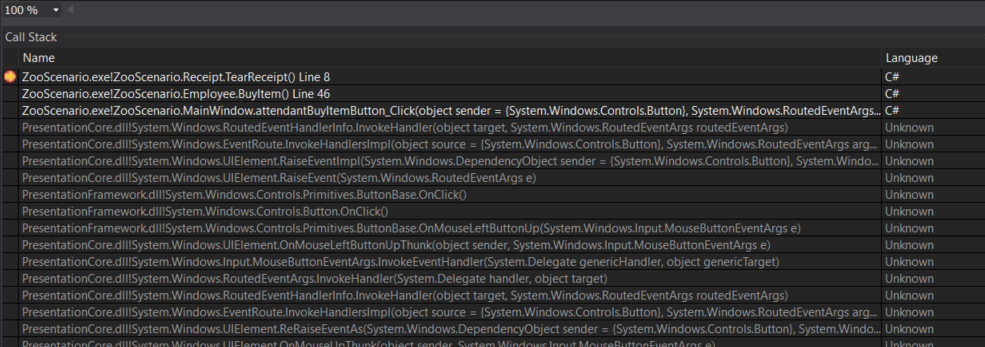
In this example the Call Stack is 3 levels deep. Let's explore what those 3 levels are. If we double click the first level it brings us to where the application began.
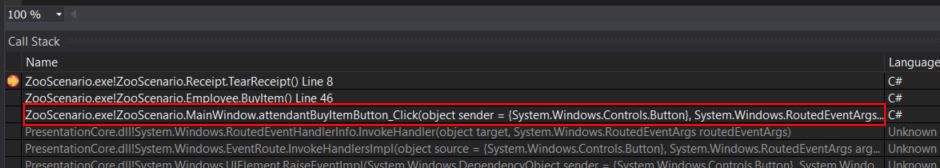
Here we can see that the first call in this sequence originated from the attendantBuyItemButton_Click event handler. This makes sense since the breakpoint was hit after pushing the 'Attendant Buy Item' button in the application. Also note that the Attendant object is what is invoking the call. So let's double click the second level of the Call Stack to see where it goes.
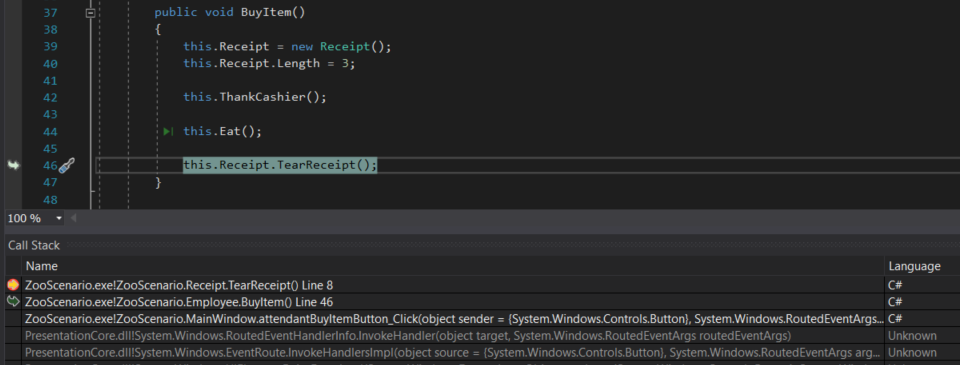
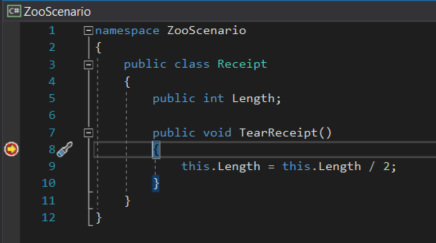
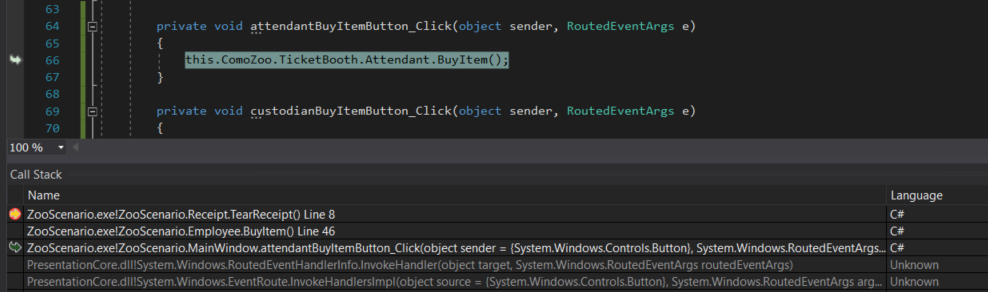
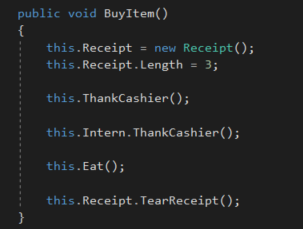
It takes us to the BuyItem method in the Employee class. Here we can see there's a call to the TearReceipt method invoked by the Receipt object. Now if we double click the third level it takes us to where the application has stopped.
Now we have a better idea of how we got to that TearReceipt method. A button click was invoked, which called BuyItem which called TearReceipt. The sequence diagram for this would look like:
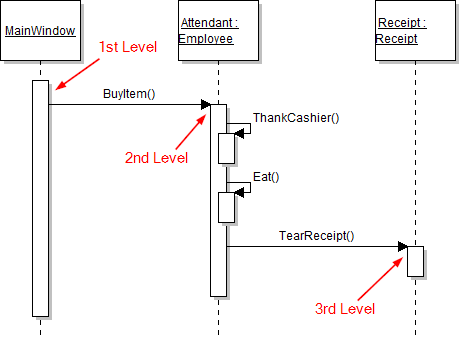
Note that the Call Stack does not include the calls to ThankCashier and Eat. Those methods don't have anything to do with how we got to the TearReceipt method.
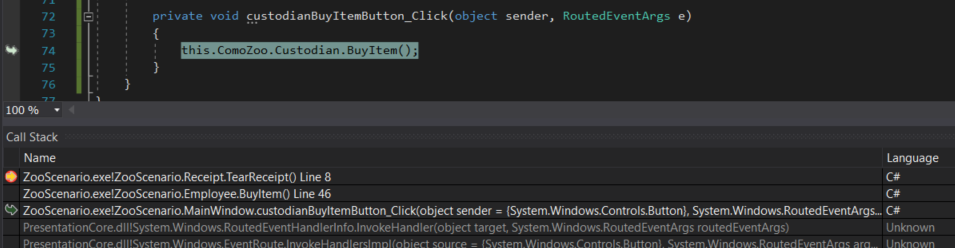
The Call Stack not only shows us how we got to a certain place but it also helps us understand what objects got us there. For instance, in the example above we determined that the Attendant object was what invoked the call to BuyItem. But there's another object that calls BuyItem -- the Custodian. Let's restart the application and instead click the New Como Zoo button and then the Custodian Buy Item button.
The Call Stack looks nearly identical to the previous example. But when we click the first level we can see that the call comes from the Custodian object now instead of the Attendant object.
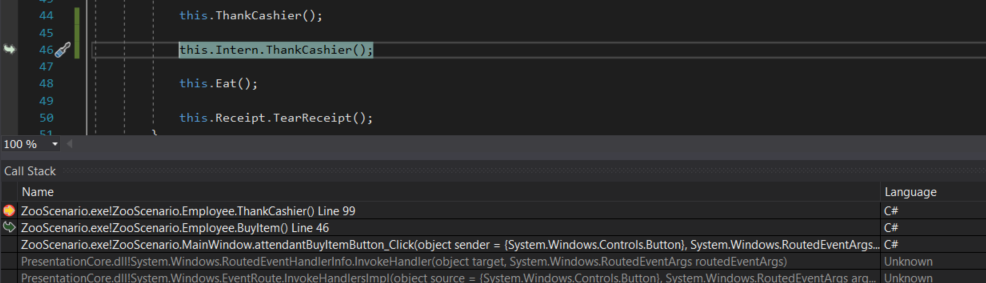
Let's look at a trickier example of this. Let's say the Attendant now has an intern they are responsible for and the intern repeats the same behavior as the attendant.
We want to see what object calls the ThankCashier method so we'll put a breakpoint at the beginning of the method.
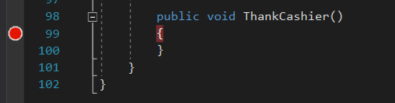
We'll then start the application, click the New Como Zoo button and the Attendant Buy Item button.
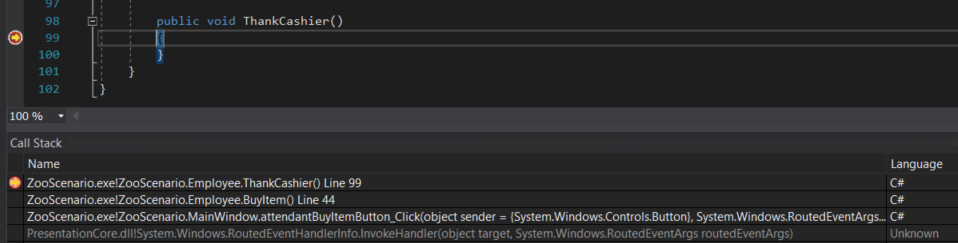
The breakpoint is hit and Call Stack gives us this information. Now let's press F11 until the breakpoint is hit again. The Call Stack will look exactly the same.
However, when we double click the second level of the Call Stack we can see what object invoked the call. In this case it was the Intern object.