2.3.2 Representing 2D Arrays in Object Diagrams

Representing 2D Arrays in Object Diagrams

The Wildcats record goals for two training sessions, with three drills in each session. Extend the indexed snapshot from the 1D lesson: each position now needs a row index and a column index.

Read the Code Before Drawing

These statements run inside an existing method. Rows identify sessions; columns identify drills. Take the snapshot after the correction.

A rectangular score array
int[,] roundGoals = { { 2, 0, 3 }, { 1, 4, 0 } };
roundGoals[1, 2] = 2;
Read the Coordinates Before Drawing

Create two rows and three columns, then change the last score in the second row from 0 to 2. The first index is the row and the second is the column. Physical session 2 therefore uses row index 1.

Scores after the correction
Column 0 Column 1 Column 2
Row 0 2 0 3
Row 1 1 4 2
Build the Diagram in Violet
  1. Create an object diagram with one instance headed roundGoals : int[,]. Preserve the comma inside the type brackets.
  2. Add field-name rows [0, 0], [0, 1], [0, 2], [1, 0], [1, 1], and [1, 2]. Enter the matching current values from the table in Violet's value areas.
  3. Add a note 2 rows; 3 columns; Length = 6; after correction. Keep the six coordinate pairs in the object box even if you arrange the table differently on the page.
  4. Save and verify that [1, 2] contains 2. These elements hold integers directly, so no separate target objects or reference arrows are needed.
Compare the Completed Soccer Diagram
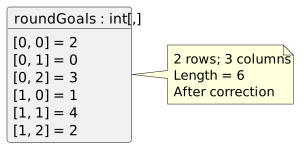
One integer array has two rows and three columns with scores 2, 0, 3, 1, 4, and 2 after the correction.
Six scores identified by row and column
  • New
  • Changed
  • Removed
Verify the Snapshot Moment