A clean table can contain hundreds or thousands of records.
Reading every row manually is rarely the best way to answer a question.
Spreadsheet tools support several basic exploration operations:
Each operation answers a different kind of question.
Suppose a song table contains:
| Title | Artist | Genre | Year |
|---|---|---|---|
| Northern Lights | Example Band | Rock | 2024 |
| Side Street | Dana Lee | Jazz | 2022 |
| Open Road | Example Band | Rock | 2021 |
Sorting by Year can reorder the records.
Ascending:
2021
2022
2024
Descending:
2024
2022
2021
The records are the same.
Their displayed order changes.
If you sort only the Year cells while leaving titles and artists in place, the rows become incorrect.
A record's values must move together.
Spreadsheet sorting tools are designed to reorder the table as records.
Use them rather than manually moving one column independently.
A filter can answer:
Show only Rock songs.
The underlying dataset may contain Jazz and other genres.
The filtered view temporarily hides records that do not meet the current condition.
Filtering is useful when you want to focus on a subset without deleting the other records.
If a sheet displays only:
Genre = Rock
other records may still exist in the dataset.
They are simply excluded from the current view.
This distinction matters when interpreting counts or screenshots.
Always notice whether a filter is active.
You might ask:
Show Rock songs released in 2024.
That uses more than one condition.
The exact spreadsheet controls vary.
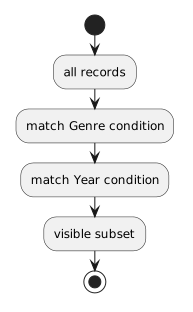
The reasoning is stable:
all records
↓
match Genre condition
↓
match Year condition
↓
visible subset
A summary reduces many records into useful results.
For example:
How many songs are in each genre?
Possible result:
| Genre | Song Count |
|---|---|
| Jazz | 12 |
| Rock | 28 |
| Pop | 19 |
The summary is not a replacement for the original records.
It is a new view derived from them.
If the question is:
How many songs belong to each genre?
a count makes sense.
If the question is:
What is the average rating by genre?
an average may make sense if a numeric rating field exists.
Do not choose a calculation merely because the spreadsheet tool offers it.
The aggregation should fit the meaning of the field and the question.
Suppose Genre contains:
Rock
rock
ROCK
A summary may show three groups.
The spreadsheet is accurately summarizing the values it received.
The underlying data is inconsistent.
This is why cleaning comes before serious interpretation.
Sort
Change record order.
Filter
Show a selected subset.
Summarize
Calculate or group information across records.
A spreadsheet workflow may use all three.
Do not confuse them.
Instead of:
I need to use a filter because that is the next button.
begin with:
What am I trying to learn from the data?
Then choose the operation.
Examples:
Question: Which songs are newest?
Operation: Sort by Year descending.
Question: Which songs are Rock?
Operation: Filter Genre.
Question: How many songs are in each genre?
Operation: Summarize by Genre.
The question gives the spreadsheet operation a purpose.
Sorting, filtering, and summaries are ways to examine the dataset.
Avoid destroying or rewriting source records simply to produce a particular view.
A strong analysis keeps the original data available while creating useful views from it.